9. State Transition Diagrams (cont)
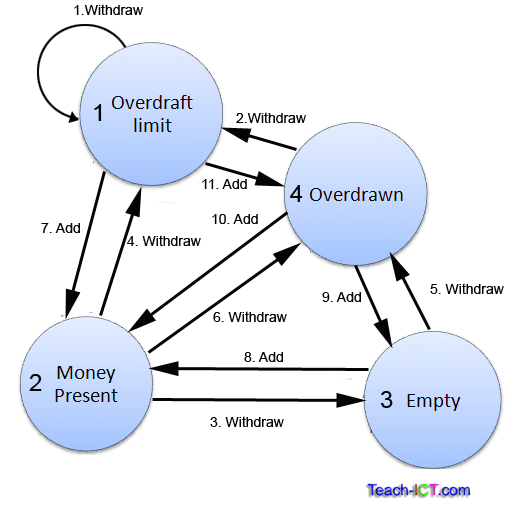
Bank account state transition diagram

Some of the details you see in the STDs above are:
1. Each state is represented as a square or circle.
2. Each state has a name and / or a number to identify it
3. Each transition is a straight or curved line ending with an arrow.
4. Each transition has a description and a number. Again this aids identification
5. Most transitions will move the system from one state into another, but it is possible to have a transition start in a state and end up in the same state. For example with the bank account which is in the 'overdraft limit reached' state, attempts to withdraw money will just end up in the same state. This is a 'loop' and is useful to show that some events that happen will not change system state.
6. You can also state the condition required to allow a move from one state to another. For example in the bank example, the '7. Add' transition will occur if the Add money event is = Overdraft Limit + £1. i.e. you will have some money in the account if you deposit a pound more than the overdraft limit.
Problems with State Transition Diagrams
State transition diagrams are excellent for a single object such as 'bank account', but they can get very complicated, very quickly for multiple objects. For example trying to draw a state transition diagram for all types of account at a bank, each with different transitions and conditions.
Because STD are so useful to describe a system, there are software applications that can create them automatically from formal statements.
challenge see if you can find out one extra fact on this topic that we haven't already told you
Click on this link: Using State transition diagrams
