10. Data Flow Diagrams (DFD)
Whilst state transition diagrams can show how the system moves from one state to another, sometimes the emphasis is to understand how data is changed as it flows through the system.
And this is the strength of another analysis tool called a 'Data Flow Diagram' or DFD.
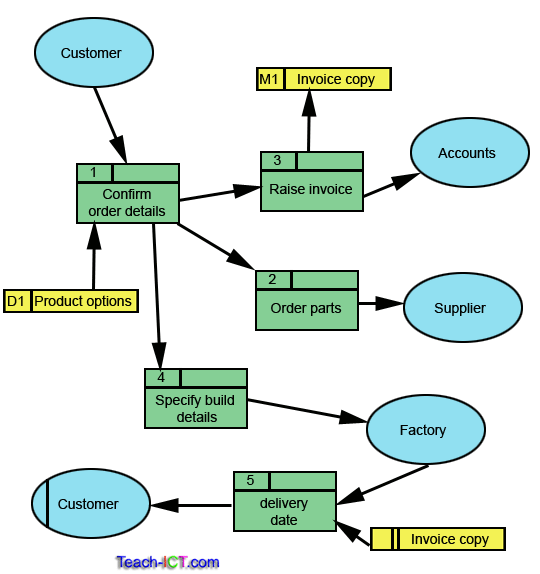
Data flow diagrams are often used to show how an organisation handles incoming data such as a customer order.
Here is an example what happens to an order within an example department called 'order control'.

The next few pages will use this diagram to explain the key parts of a data flow diagram
challenge see if you can find out one extra fact on this topic that we haven't already told you
Click on this link: Creating DFDs
