1. Introduction
One of the key things that the Systems Life Cycle process requires is the ability to write down all aspects of the data and system in a neat, clearly understood and well organised manner.
For example, say you were asked to set up an IT system in a busy medical surgery and you had no idea about the techniques you will learn about shortly.
You could write a statement like this
The system is to support all the IT requirments of the surgery. This involves handling appointments, handling prescription records and patient records. It will let people know of the next appointment slot. It will inform the doctors of their schedules for the week. And it will include some other features which have not been quite defined as yet by the customer.
Can you see what is wrong with this as a specification for the job in hand?
The problem is that it is very vague:
- how many doctors?
- how many patients?
- how are appointments processed?
- how are cancelled appointments dealt with?
- Do certain medicines have to be treated differently? - and so on.
The questions seem endless because the statements are wide open to different interpretation.
A job that is laid out in this manner is bound to end up with misunderstandings.
 In order to overcome such problems there are a set of analysis tools or techniques that can be used to help quantify the requirements of a project.
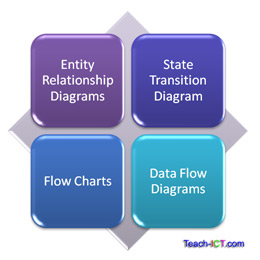
The techniques you will learn about in this mini-web are
- Entity Relationship diagrams
- State diagrams
- Data flow diagrams
- Flow charts
Each of these have their advantages and disadvantages. A skilled analyst will use a mix of these to help define the system.
