

 Functional Skills
Gantt Charts
A Gantt chart looks like a horizontal bar chart. It is used to help plan out and track specific tasks in a project.
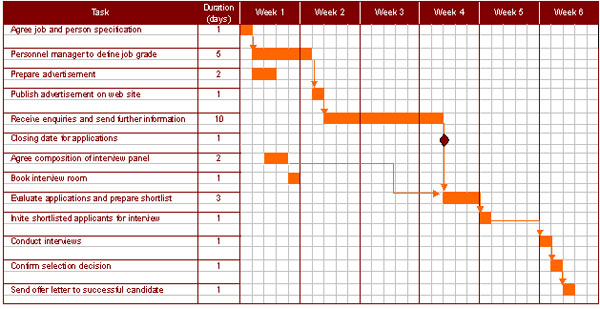
Time is generally on the horizontal axis of the chart and the activities that need to be completed are arranged vertically from top to bottom in the order of their start dates.
Looking at the chart above you can see that the weeks are split into 5 days. The amount of days that each task will take are filled in as a block of colour.
You can see that task 1, 'agree job and person specification' will take 1 day to complete. That task has to be completed before task 2 and 3 can be started. Task 2, once started, will take 5 days to complete. The arrow from task 2 to task 4 indicate that task 2 must be completed before task 4 can begin.
Task 3, task 7 and 8 can all be going on at the same time as task 2. This probably means that someone else is taking responsibility for them and so they can all run consecutively.
The purpose of a Gantt chart is to give the project manager a visual representation of what tasks will be happening at any given time, how long each task will take to complete and by when each task should be finished.
The four main features of a Gantt chart are:
- Milestones
- Resources
- Status
- Dependencies
Copyright © www.teach-ict.com